JAN 06, 2016
How to Enter PQRS Data in the Web Portal
Updated July 8, 2016
The Academy’s IRIS® Registry web portal provides a way for ophthalmologists to successfully participate in the Physician Quality Reporting System without an electronic health record system. This guide explains how to enter data into the web portal. To use the web portal for 2016 reporting, you must enter all data by Jan. 15 and submit your data-release consent form.
1. Decide what patient charts you need to enter.
To do this, you may want to run practice management system or EHR reports, pull patient charts, etc.
- Example: To pull charts for Measure 12: Primary Open Angle Glaucoma (POAG): Optic Nerve Evaluation, you would use your practice management system to run a report for Medicare Part B, Medicare as a Secondary Payer, and Railroad Retirement Board patients with a diagnosis of POAG.
2. Organize your charts.
For ease of entry, you'll probably want to organize charts by provider, if applicable, and then by measure.
- For any provider who practices at multiple locations, be sure to also separate charts/reports by TIN.
- Keep in mind that certain diagnoses apply to multiple measures. For example, POAG patient applies to measure 12 and 141. Review measure specifications.
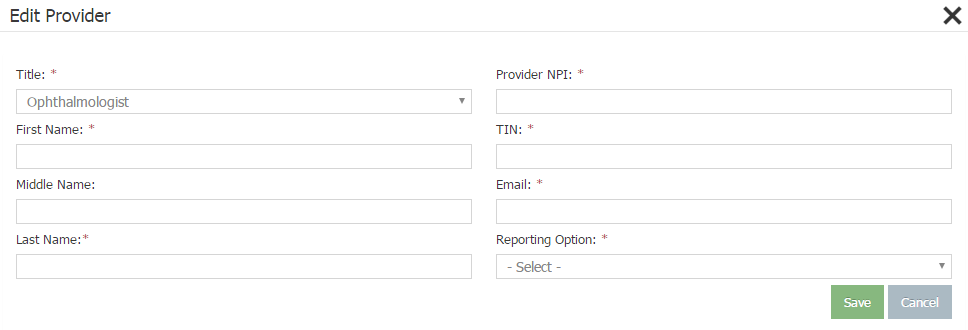
3. Log into the web portal and add or edit the provider’s information.

4. Review the provider’s PQRS reporting option and choose measures.
This section tells the registry what to report to CMS. Review measure specifications.
5. Enter patient charts.
- Click "Add Patient" or "Add Procedure" to add a patient or procedure.

- Look up or add the patient name, then enter the rest of the visit information and click Proceed.
- For individual measures or QCDR reporting, choose the measures for which you can report and complete the form. Be sure to include the codes used. You can report additional measures for that patient later, if need be. For catarcts measures group or diabetic retinopathy measures group reporting, make sure to complete all questions.
- Click Finish and enter the next patient chart.
Save