MAR 11, 2016
How to View 2015 Data in the Dashboard
The IRIS® Registry dashboard displays data using a rolling frame of reference. Depending on how you use the registry’s reporting tools, that means your report may combine data from multiple years.
How to view data for a calendar year
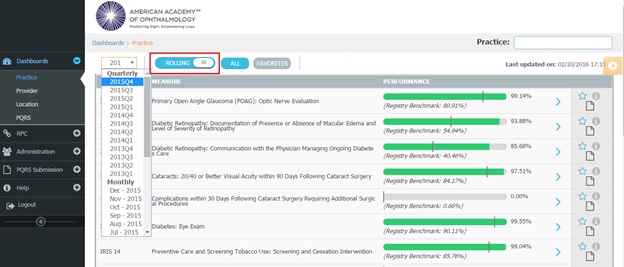
- Choose the type of dashboard you want to view and open the data-view dropdown.
- Make sure the Rolling toggle is on to see 12 months worth of data.
- Click the drop-down menu to select if you wish to view quarterly or monthly data. Scroll through the list to find the year you wish to view data for and choose the report ending Q4 (2015Q4 to view 2015 calendar-year data).

Why the IRIS Registry use a rolling frame
Measures used in federal reporting programs – the Physician Quality Reporting System and meaningful use – collect and submit data on a 12-month reporting basis. If the registry showed users only their 2015 data in the early part of the year, the few-week or few-month performance would be very low. To provide a more accurate picture of physician performance, the registry displays data for a longer period of time, even if it spans multiple years.