Visual impairment is a national and global health concern that has a negative impact on physical and mental health. Visually impaired individuals are at particularly high risk for chronic health conditions, accidents, social withdrawal, depression, and mortality. The number of people with visual impairment and blindness is increasing due to an overall aging population. Accordingly, initiatives like Healthy People 2020 Vision aim to improve visual health by reducing visual impairment and blindness in the United States.
The information presented below is an overview of the causes of visual impairment and legal blindness in the United States. Detailed shifting demographic forecasts are also provided. Visual impairment is defined as 20/40 vision, or worse, in the better eye even with eyeglasses. Whereas a person is legally blind if their visual acuity, with best correction in the better eye, is worse than or equal to 20/200, or their visual field is less than 20 degrees in diameter. The content on this page is generously provided by the University of Illinois at Chicago (UIC). The American Academy of Ophthalmology thanks UIC for sharing their data.
Causes of Visual Impairment
Non-Hispanic Whites
Cataract (42.2%)
Age-related macular degeneration (28.1%)
Others (22.7%)
Diabetic retinopathy (4.7%)
Glaucoma (2.3%)
African Americans
Cataract (41.7%)
Others (27.0%)
Diabetic retinopathy (12.2%)
Glaucoma (11.3%)
Age-related macular degeneration (7.8%)
Hispanics
Cataract (48.0%)
Others (16.2%)
Diabetic retinopathy (15.0%)
Age-related macular degeneration (14.5%)
Glaucoma (6.4%)
|
Causes of Legal Blindness
Non-Hispanic Whites
Age-related macular degeneration (46.6%)
Others (27.6%)
Cataract (10.3%)
Diabetic retinopathy (6.9%)
Glaucoma (5.2%)
African Americans
Others (43.8%)
Cataract (25%)
Glaucoma (18.8%)
Diabetic retinopathy (8.3%)
Age-related macular degeneration (4.2%)
Hispanics
Others (39.5%)
Age-related macular degeneration (23.7%)
Diabetic retinopathy (18.4%)
Glaucoma (10.5%)
Cataract (7.9%)
|
Total Burden Forecast
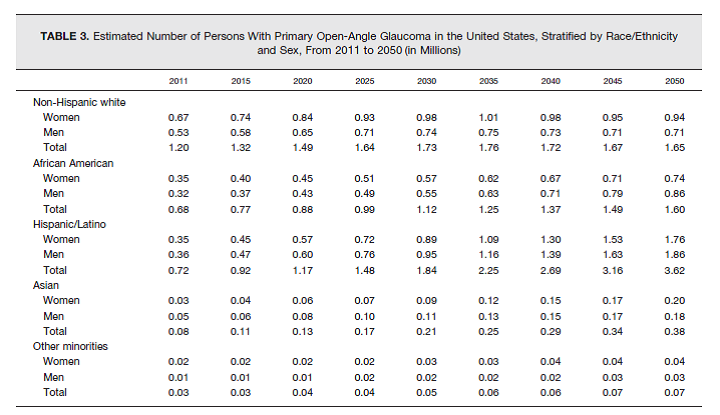
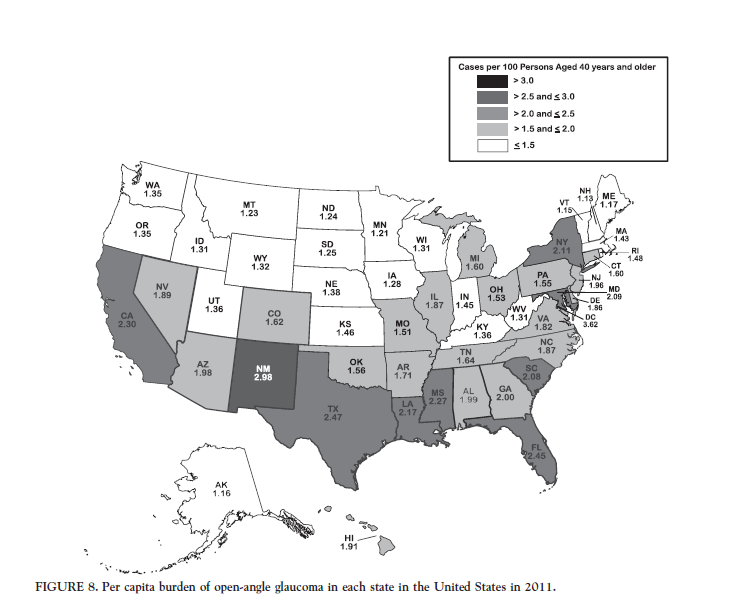
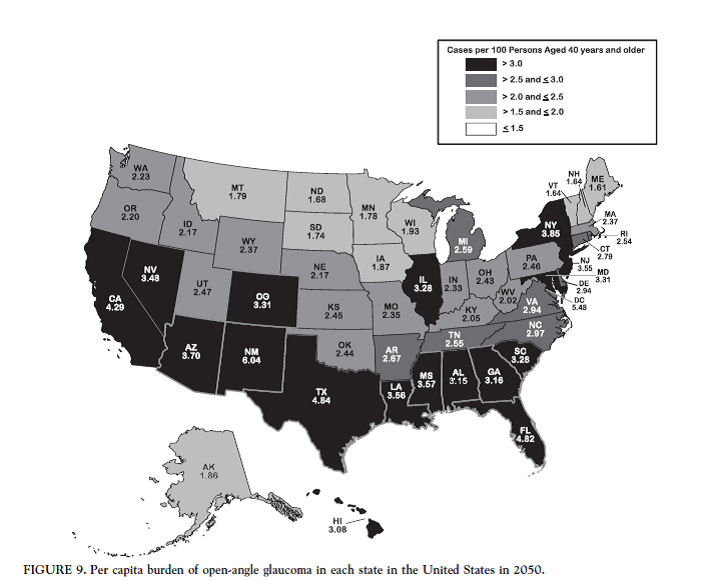
An estimated burden forecast of the total number of persons with visual impairment and blindness is important for public health policy planning. Forecasts using pooled prevalence rates, including more recent data for minority groups such as Hispanics and Asians, improve the accuracy of estimations, particularly for growing minority groups. Highlighting how demographic differences (age, sex, and race/ethnicity) within the US are related to geographic variations in the burden of visual impairment and legal blindness is also important. The forecasts below show 1) the estimated numbers of persons with visual impairment/blindness and primary open-angle glaucoma (POAG) during 2011–2050 by demography (Table 3), and 2) a per-capita case density of visual impairment/blindness and POAG by state (Figures 8–9). An online calculator is also available to calculate the estimated numbers of persons with visual impairment/blindness and POAG in your community.
A 40-Year Forecast for POAG
In 2011, 2.71 million people in the United States had POAG, with the highest estimated number among populations aged 70 to 79 years (31%), women (53%), and non-Hispanic whites (44%). The largest demographic group is non-Hispanic white women.
In 2050, an estimated 7.32 million people in the United States will have POAG, with the highest number among populations aged 70 to 79 years (32%), women (50%), and Hispanics (50%). The largest demographic group is Hispanic men.
Despite the high prevalence of POAG in African Americans and Hispanics, the largest group in the United States with POAG is among older non-Hispanic white women (2011), but is expected to shift to Hispanic men over the next few decades.

Source: American Journal of Ophthalmology 2012 (with permission). Prevalence rates from selected population based studies (Baltimore Eye Survey, Los Angeles Latino Eye Study and Singapore Study) were used to estimate the number of persons aged 40 years and older with POAG in the United States. For calculation, the age-, sex-, and race/ethnicity-specific prevalence rates were multiplied by the US Census estimates and projections from 2011 to 2050.
During the next 40 years, the highest per capita POAG burden will double in New Mexico, Texas, and Florida. Given this demographic shift, the greatest yield from screening programs is likely to be in those states with high numbers of non-Hispanic white women and Hispanic men.


Source: American Journal of Ophthalmology 2012 (with permission).
Online Calculator: What is the Forecast in Your Community?
 Enter numbers for population by age, sex, and race/ethnicity to estimate the projected number of people with blindness or POAG in your community.
Interactive Online Calculator
References
- Saaddine JB, Narayan KM, Vinicor F. Vision loss: a public health problem? Ophthalmology. 2003;110(2):253-254.
- Li, Y., et al., Visual impairment and health-related quality of life among elderly adults with age-related eye diseases. Qual Life Res, 2011. 20(6): p. 845-52.
- Crews, J.E. and V.A. Campbell, Vision impairment and hearing loss among community-dwelling older Americans: implications for health and functioning. Am J Public Health, 2004. 94(5): p. 823-9.
- Ivers, R.Q., et al., Visual impairment and risk of hip fracture. Am J Epidemiol, 2000. 152(7): p. 633-9.
- Jones, G.C., et al., Effects of depressive symptoms on health behavior practices among older adults with vision loss. Rehabil Psychol, 2009. 54(2): p. 164-72.
- Zhang, X., et al., Association Between Depression and Functional Vision Loss in Persons 20 Years of Age or Older in the United States, NHANES 2005-2008. JAMA Ophthalmol, 2013: p. 1-9.
- Lee, D.J., et al., Visual acuity impairment and mortality in US adults. Arch Ophthalmol, 2002. 120(11): p. 1544-50.
- Congdon, N., et al., Causes and prevalence of visual impairment among adults in the United States. Arch Ophthalmol, 2004. 122(4): p. 477-85.
- Congdon, N.G., D.S. Friedman, and T. Lietman, Important causes of visual impairment in the world today. Jama, 2003. 290(15): p. 2057-60.
- Bourne, R., et al., Global burden of visual impairment and blindness. Arch Ophthalmol, 2012. 130(5): p. 645-7.
- Bourne, R., et al., New systematic review methodology for visual impairment and blindness for the 2010 Global Burden of Disease study. Ophthalmic Epidemiol, 2013. 20(1): p. 33-9.
- Vajaranant TS, Wu S, Torres M, Varma R. The changing face of primary open-angle glaucoma: demographic and geographic changes from 2011–2050. Am J Ophthalmol. 2012 Aug; 154 (2): 303–314.
- Vajaranant TS, Wu S, Torres M, Varma R. A 40-year forecast of the demographic shift in primary open-angle glaucoma in the United States. Invest Ophthalmol Vis Sci. 2012 May 4; 53 (5): 2464–6.
Acknowledgements
The American Academy of Ophthalmology would like to thank the University of Illinois at Chicago for sharing their data on US eye disease statistics.