By Nicola Parry, Contributing Writer, interviewing Brian A. Francis, MD, MS, Joseph Panarelli, MD, and Harry A. Quigley, MD
Download PDF
Prompt therapeutic intervention is important in preventing visual loss in glaucoma, yet standard diagnostic tools fail to catch retinal ganglion cell (RGC) damage at the earliest stages. Automated perimetry testing, for example, does not detect RGC damage until about 25% to 35% of the RGCs have been lost.1 Would earlier detection of RGC dysfunction improve the management of glaucoma?
Another technology—pattern electroretinography (PERG)—which has been used experimentally for years to identify early glaucoma damage to RGCs, may provide answers. More recently, commercial devices—Diopsys’ Nova and Argos Vision Testing Systems and Konan Medical’s EvokeDx—have become available. These machines are equipped with PERG and visual evoked potential (VEP) software; the Diopsys also includes full-field electroretinography. Early adopters of these devices discuss whether this technology might have clinical usefulness.
What Is PERG?
The pattern electroretinogram measures the electrical activity of the retina in response to a test stimulus, such as a reversing checkerboard. It is a noninvasive, direct, and objective method for assessing RGC function. Studies with lab-based PERG devices have shown its usefulness in detecting early RGC damage in glaucoma suspects.2-6
PERG in the Clinic
Commercially available PERG technology takes the principles of laboratory-based electrophysiology and places it a more user-friendly format, said Brian A. Francis, MD, MS, at the Doheny Eye Institute in Los Angeles. Although office-based technology does not completely take the place of laboratory-based electrophysiology testing, he said, it overcomes the impracticality of referring glaucoma patients for extensive laboratory tests.
Adjunctive technology. In-office machines can serve as adjuncts to the tools that ophthalmologists already have available, said Joseph Panarelli, MD, at the Icahn School of Medicine at Mount Sinai, New York City. Although he relies chiefly on the clinical examination when evaluating patients for glaucoma, he explained that additional testing, including clinic-based PERG, can be particularly helpful for patients who present a diagnostic dilemma.
Dr. Panarelli noted that advances in technology over the years have greatly improved ophthalmologists’ ability to diagnose glaucoma. For example, “Optical coherence tomography [OCT] has been a huge help to the glaucoma specialist,” he said. “Though many of us carefully evaluate the optic nerve, there are times when the OCT ‘sees’ something that we do not.” He noted, however, that an OCT image of an anomalous nerve, coupled with borderline intraocular pressures (IOPs), might not provide enough information for a glaucoma diagnosis. Although visual field testing can be used in this situation, it is inherently subjective, and some patients need to repeat the test multiple times before the results are reliable. For such ambiguous cases, he said, “This is where these clinic-based [PERG] devices come in—they provide an objective way to evaluate the [functional status of the] visual pathway.”
 |
|
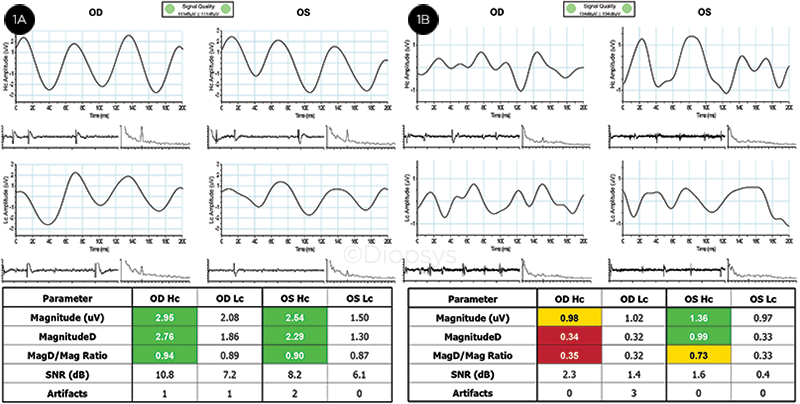
PERG. (1A) Results from a person with healthy eyes. All results are within reference ranges (green), and the waveform appears as 3 equally spaced sinusoidal-like peaks. Results indicate good retinal ganglion cell function. (1B) Glaucoma suspect tested. Borderline/outside-reference-range results in the right eye (yellow/red), and within-reference-range/borderline results for the left eye are shown. Waveform shapes are not typical for a steady-state PERG response. Results indicate poor retinal ganglion cell function.
|
How to Use PERG
“PERG can help identify pathology even before structural lesions are evident, and therefore before they are detectable using OCT or visual field testing,” said Dr. Francis.
Whom to test. Dr. Francis uses PERG for patients in whom he suspects glaucoma but the clinical picture is unclear or the visual field testing unreliable. “PERG can help improve differentiation of the diagnosis in these patients, where the data don’t add up,” he said. (See “Case Report,” below.)
Dr. Francis also uses PERG in patients diagnosed with glaucoma to monitor their response to medical, surgical, or laser therapy. He said PERG is useful for most patients with mild glaucoma because the technology allows him to establish a baseline for later PERG testing during treatment follow-up.
Performing the test. “Diopsys is a patient-friendly device because testing sessions are noninvasive,” said Dr. Francis. Electrodes on sticky pads are placed on the patient’s forehead and around the eyes. He said that the entire procedure—including preparation—takes about 15 to 20 minutes, and the actual testing takes less than 5 minutes. According to Dr. Francis, it requires less time than a visual field test, “and the patient doesn’t have to do anything except look at the stimulus and pay attention.”
Similarly, Dr. Panarelli said that very little technical expertise or training is needed to use the EvokeDx machine. “The test is easy to set up. In my practice, most of these tests are performed by technicians or medical students. In just a short afternoon, they can learn how to properly place the electrodes and how to instruct the patient to accurately complete the test. Further, Dr. Panarelli noted that patients find clinic-based PERG easier than visual field testing.
How often to test. Dr. Francis acknowledged that there are no established guidelines for PERG testing intervals. “In my practice, I repeat PERG testing if something triggers the need for it—for example, if I’m going to be doing a specific treatment, or if IOP is high and I need to step up treatment, or if I feel the patient is getting worse but I’m not seeing evidence of worsening on visual field testing or OCT.”
Case Report
Dr. Francis discussed use of PERG in a 66-year-old woman. Collaborating with his colleague, Careen Caputo, OD, a visiting assistant scientific researcher at UCLA, he determined that the patient had high myopia in the left eye and mild to moderate myopia in the right eye. “Compared with the right eye, the left eye showed optic disc tilting, atrophy, and cupping,” said Dr. Francis. “Visual field abnormality was also found in the left eye.” In cases like this, Dr. Francis stressed that OCT results may be unreliable because of the long axial length associated with high myopia. This presented a clinical conundrum, he said, because “all objective signs were suggestive of glaucoma, but we were unsure as to whether it was actually glaucoma or myopia.”
This is exactly the type of situation in which PERG is useful, he said. “In this case, [PERG] was normal [symmetrical] in both eyes, so I was comfortable making a diagnosis of suspected glaucoma and observing this patient, avoiding unnecessary treatment.”
|
Issues to Consider
Learning curve. Even though clinic-based PERG testing is simple to administer, interpreting the results is another story. PERG is not as easy to evaluate as a visual field test or OCT, said Dr. Panarelli. “It’s more neurology than ophthalmology, and clinicians need to be sure they understand what the test entails before using the device,” he explained.
Before he started using the EvokeDx, Dr. Panarelli said that he spent a few weeks reviewing medical literature on PERG, talking with researchers, and re-learning the pathology of neuronal loss, visual pathways, and on-off responses. After speaking extensively with representatives from the device manufacturer, he devoted further time to learning how to perform the test on patients as well as on himself.
Room for improvement. Currently, the Diopsys and EvokeDx devices are somewhat lacking in sensitivity and specificity, said Dr. Francis and Dr. Panarelli. Dr. Francis added that the test may not be particularly useful in patients with very poor vision. Patients must take the test with their best-corrected vision, “so high myopes must wear either their glasses or contact lenses while doing the test,” he said. “Artefacts also occur if the patient is blinking or not paying attention.”
“The in-office technology will improve in time,” said Dr. Francis. “This is the first generation of this Diopsys device. The first generation of OCT was nowhere near what we have today.” In particular, he believes the sensitivity and specificity of the technology will improve, resulting in less variation between tests and fewer artefacts.
Dr. Panarelli noted that while the EvokeDx device seems to be particularly useful to help assess central vision and evaluate damage to magnocellular axons, it does not appear to be as useful for mapping specific structural changes or peripheral defects. “A multifocal visual evoked potential would be better to evaluate such changes or defects,” he said. Dr. Francis concurred, saying that the Diopsys system does not perform a multifocal electroretinogram, which would be required to detect localized damage. Therefore, he noted, this in-office tool does not appear to be useful in providing the kind of detailed clinical information that ophthalmologists have come to expect from visual field testing and OCT.
Harry A. Quigley, MD, at Johns Hopkins University in Baltimore, noted that a maximum signal-to-noise ratio is desired for any test that is used for glaucoma. “However, for electrophysiology, this ratio is very narrow, and it may be so narrow that it significantly limits its usefulness,” he said.
Dr. Panarelli agreed, and he highlighted this as one of the reasons why these clinic-based devices require further research (which he is conducting, see “Clinical study under way,” below). “We need to keep investigating the limitations of these testing modalities and see where their strengths lie.”
Guidelines and data needed. Dr. Panarelli also emphasized that the current lack of guidelines or diagnostic algorithms makes it challenging for ophthalmologists to apply data from these devices to clinical practice. “We may obtain data telling us there is a reduced signal, but, as yet, we don’t really have enough literature to help us accurately interpret this and tell us what it really means for the patient. However, comparing data output from one eye to the other can be helpful, to see if the comparison fits with everything else we see clinically.”
Cost. Dr. Quigley questioned whether the typical ophthalmologist would find it useful to spend money on a PERG device. At approximately $50,000, this is an expensive instrument, he said, and ophthalmologists need more information before they consider buying it to use in their own glaucoma practice. “They would want to be sure that it is somehow better than something we do now, or is highly additive to something we do now,” he emphasized. “This has not yet been shown with this in-office device in a way that has been peer reviewed and is analyzable.”
More at the Meeting
Attend Glaucoma Subspecialty Day
Register online at aao.org/2017. When: Saturday, Nov. 11. Where: New Orleans Theatre AB. Access: Ticketed event.
|
Answers Needed
Given the lack of data for these clinic-based devices, many questions remain.
Role in practice. Dr. Panarelli is using EvokeDx mostly for diagnostic purposes. “I don’t know yet whether it will be useful to monitor glaucoma progression,” he said. “Will this test ultimately be able to just tell us ‘disease’ or ‘no disease,’ or will it also prove useful to determine glaucoma severity and to track progression of disease?”
He added that it remains to be seen who will ultimately adopt these modalities in practice: “Will these devices have more general use by optometrists and general ophthalmologists, or will they occupy more of a niche market for glaucoma specialists and neuro-ophthalmologists?” New tools and treatments in glaucoma may enhance clinicians’ ability to provide better care, he said, “but we have to understand that they all have limitations, and we need to understand these limitations before we widely adopt them.”
Clinical study under way. Dr. Panarelli is performing a clinical study with the EvokeDx device in 150+ patients, including those who are glaucoma suspects, those who have preperimetric glaucoma, and those who have glaucoma with varying degrees of visual field loss. “The aim is to see if the EvokeDx can be used to reliably separate patients into these groups. We want to see how sensitive and specific this test is at picking up different degrees of damage.”
By using EvokeDx to examine patients with different severities of glaucoma, Dr. Panarelli hopes to determine whether any differences exist in their test results (the evoked potentials) based on visual field loss. “I’m particularly interested in comparing patients who are glaucoma suspects to those with preperimetric glaucoma. I would like to see if this modality really can help us to pick up glaucoma earlier,” he said. “Eventually, I want to use the test in patients who are diagnostic challenges to help me make better treatment decisions. Medical therapy is costly and can be a life-long burden to patients.”
Dr. Panarelli said these diagnostic challenges may include patients who have normal-tension glaucoma, patients who have anomalous discs (high myopia), and certain high-risk patients in whom medical therapy may or may not be needed (pigment dispersion syndrome). “If I had a test that would allow me to examine a patient and then tell them ‘This looks like glaucoma and it’s not just your myopia’, that would be ideal,” he said.
___________________________
1 Bode SF et al. Invest Ophthalmol Vis Sci. 2011;52(7):4300-4306.
2 Banitt MR et al. Invest Ophthalmol Vis Sci. 2013;54(3):2346-2352.
3 Ventura LM et al. Ophthalmology. 2005;112(1):20-27.
4 Ventura LM et al. Invest Ophthalmol Vis Sci. 2006;47(9):3904-3911.
5 Ventura LM et al. Invest Ophthalmol Vis Sci. 2012;53(2):659-663.
6 Ventura LM et al. J Glaucoma. 2013;22(3):255-264.
___________________________
Dr. Francis is professor of clinical ophthalmology, the Rupert and Gertrude Steiger Chair in Glaucoma, and Director of Glaucoma Services at the Doheny Eye Institute, David Geffen School of Medicine, UCLA, Los Angeles, California. Relevant financial disclosures: Diopsys: S.
Dr. Panarelli is assistant professor of ophthalmology, Icahn School of Medicine at Mount Sinai, New York City, New York. Relevant financial disclosures: None.
Dr. Quigley is A. Edward Maumenee Professor of Ophthalmology, and Director, Glaucoma Center of Excellence, Wilmer Eye Institute, Johns Hopkins University, Baltimore, Maryland. Relevant financial disclosures: None.
For full disclosures and the disclosure key, see below.

Web Extra
(click to expand)

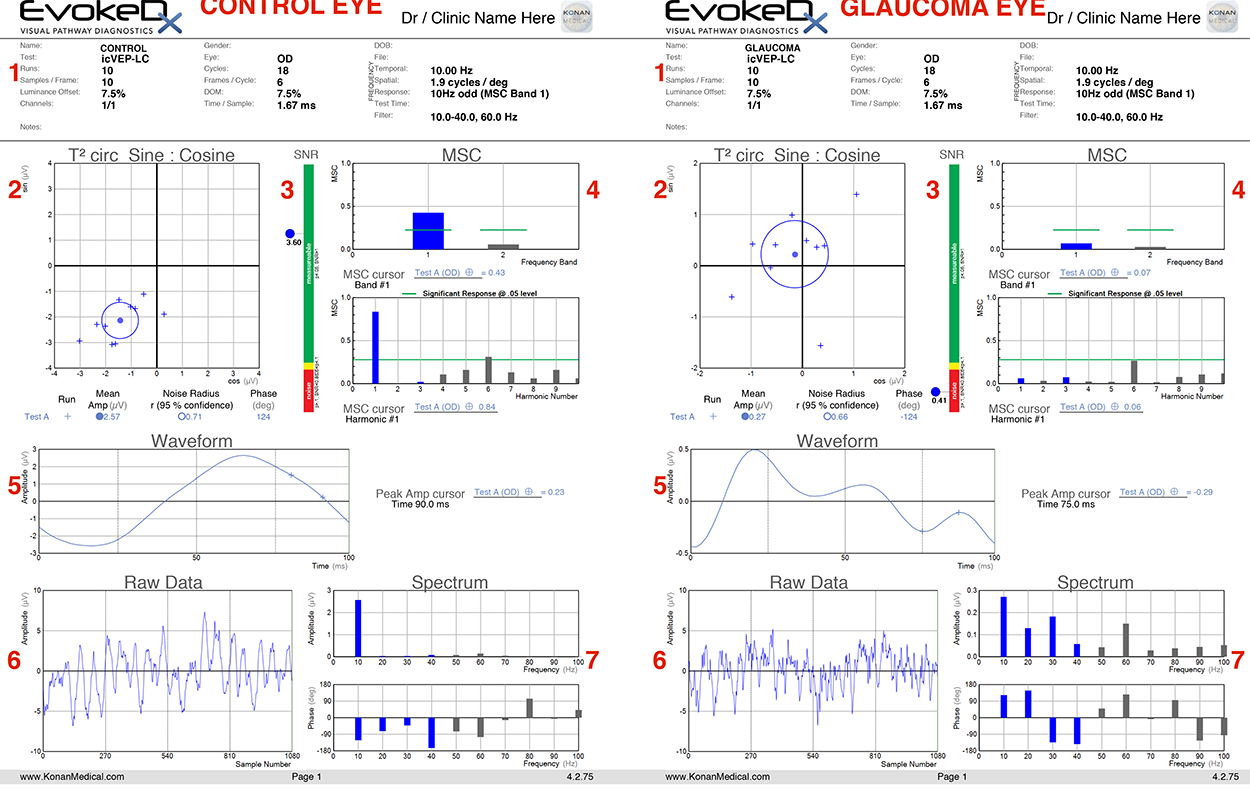
1) Test details. This section includes both patient details and details regarding the test settings. For icVEP, the test is typically run with a 15% contrast stimulus (7.5% depth of modulation), and the stimulus is presented at a frequency of 10 Hz.
2) T2circ Sine: Cosine. This section provides a simple, easy-to-read significance measurement as well as the mean values for amplitude and phase of a response. Ten trial runs, each lasting 2.5 seconds, are plotted as “+” points on the readout, with the mean value plotted as a dot. The circle surrounding the dot indicates the noise level and represents the 95% confidence interval for a given response. If this noise radius overlaps with the origin, SNR <1 and the response is non-significant at the p=0.05 level.
Note in the control example that the trials are tightly clustered and the noise radius does not include the origin, while in the glaucoma example, responses are spread among the four quadrants, and the origin is within the noise radius.
3) SNR. Signal-to-noise ratio. At a cutoff of p <0.05, SNR ≥1 indicates a significant response to the stimulus. Green indicates SNR >1, while red indicates SNR <0.85. The small yellow area corresponds to 0.85 ≤SNR <1; insignificant at p <0.05, but significant at p <0.10. SNR is calculated by dividing the mean amplitude by the noise radius, both of which are displayed in section 2.
Note the stark contrast in SNR between the control eye (3.60) and the glaucoma eye (0.41).
4) MSC. Mean squared coherence. This section estimates how well the response tracks with the stimulus presentation. 10 Hz represents the first harmonic for standard icVEP recording; harmonic number 2 represents 20 Hz, 3 represents 30 Hz, and so on. The response of interest is that which is provided by the test stimulus (10 Hz). Responses above the green line indicate significance at a p <0.05 level.
Note the high coherence of the 10 Hz response in the control eye compared to all other frequency bands, and the relatively low response in the glaucoma eye. Also worth noting is harmonic number 6—this corresponds to 60 Hz, which is the frequency of electronic background noise from the surrounding environment.
5) Waveform. The waveform is reconstructed from frequency components of the response. As the stimulus is sinusoidal, the waveform for a healthy observer should also appear sinusoidal, as in the control eye example.
Note that in the glaucoma eye, the waveform does not appear sinusoidal (multiple peaks, periods of insignificant response to the stimulus).
6) Raw Data. Response to the stimulus before mathematical transformation. In order to confirm that a test doesn’t have excessive noise interference, it is best that the amplitude of the raw data is <10 μV.
The amplitude is below this threshold in both the healthy and glaucoma eyes.
7) Spectrum. This section includes amplitude and phase responses for different frequency levels. The frequency of interest is 10 Hz, as mentioned previously. Looking at the 10 Hz frequency bars, note that the amplitude and phase value correspond to the amplitude and phase value listed and plotted in section 2.
In the control eye, the 10 Hz frequency band is much larger than that of the frequencies >10 Hz, while in the glaucoma patient the amplitudes are more comparable.
—By Owen J. Drinkwater, BS, BA, and MD candidate
Weill Cornell Medicine
|