The management of the glaucoma patient and glaucoma suspect has become more interesting as imaging technology has evolved over the past few years. Stereoscopic disc photography, HRT, GDx, time domain OCT, spectral domain OCT. Which ones should you use to help diagnose glaucoma? Which ones should you use to help monitor progression? There has been considerable debate among glaucoma specialists regarding the use of these imaging modalities and if one is superior to the others.
If you are thinking about purchasing a new machine for your office, this article will give you some useful information on the clinical utility of imaging in glaucoma.

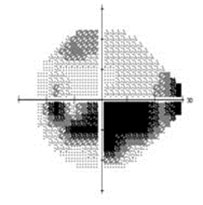
VF test from a patient with moderate glaucoma OS.
First Things First…
Before jumping into imaging, you should perform a careful ophthalmic examination, including viewing the optic nerve head (ONH) with a 78D or 90D lens at the slit lamp. Characteristics of glaucomatous optic neuropathy, such as cupping, notching of the neuroretinal rim, disc hemorrhage, nasalization of blood vessels, etc., should be noted. In addition, visual field testing should be performed annually or more frequently if you are worried about progression.
Imaging tests are used in conjunction with your exam and VF. While imaging provides objective measurements of various parameters of the posterior segment and can be compared from visit to visit, one should not solely rely on them to diagnose glaucoma or to monitor progression. The information below is to help you understand the benefits and drawbacks of the most common glaucoma imaging tests.
Disc Photographs (DPs)
Before the age of digital photography, stereoscopic photos of ONH were taken with a fundus camera through a dilated pupil and viewed with a stereo viewer. The three-dimensional image was then compared to prior photos or directly to the ONH viewed with biomicroscopy.

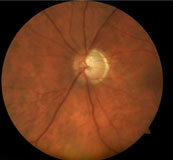
A DP of the patient.
Nowadays, DPs more commonly appear as two-dimensional images on the computer screen, although 3-D viewing is possible with the use of various devices. The neuroretinal rim on 2-D photos usually appears thicker than the actual ONH when viewed through biomicroscopy. Hence, 2-D photos should only be compared to prior DPs. Pay particular attention to the relative position of blood vessels at the neuroretinal rim. When the vessels “migrate” toward the disc margin, progression may be present.
Pros: DPs have been used in most practices for many years. They are particularly helpful in diagnosing slow progressors or glaucoma suspects, when DPs spanning 10 years or more can be compared side-by-side.
Cons: DPs only provide qualitative assessment of the ONH. Quantitative data, such as cup-to-disc (C/D) ratio, is dependent on the viewer and also the mode of viewing (2-D versus 3-D). Some fundus cameras require dilation. The quality of DP is operator-dependent.
Overlapping baseline and follow-up DPs are not done automatically and are sometimes difficult if DPs are taken with different devices or different settings (lighting, viewing angle, magnification). Furthermore, nasalization of blood vessels may appear if photos are taken from different angles, even when there is no progression of glaucoma.
Heidelberg Retinal Tomograph (HRT)
HRT is a confocal scanning laser ophthalmoscope that uses a visible-light laser to scan the surface of the retina and ONH.[1] HRT provides measurements of C/D ratio, disc rim area, rim volume and an estimate of retinal nerve fiber layer (RNFL) thickness.

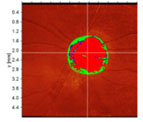
A DP of the patient.
The older generation of HRT requires manual outlining of the disc margin. The newer version 3.0 does it automatically. Built-in software uses Moorfields Regression Analysis to compare the neuroretinal rim area in six sectors to an age- and ethnicity-specific, normative database and marks the regions of abnormal narrowing.
Pros: HRT measurements can be taken through an undilated pupil. You can upgrade the older machines with newer software and superimpose images taken at different times to assess progression. HRT provides quantitative data and presents the analysis of rim area in a user-friendly manner.
Cons: In older versions of HRT, manual-outlining of the disc margin makes it difficult to compare quantitative data from various visits, especially when the operators are different. Also, the detection of abnormal rim thinning may be compromised in patients with very small or large discs. For example, a glaucoma suspect with a large disc may appear to have glaucomatous thinning marked with red Xs on the HRT.
GDx
Scanning laser polarimetry, commercially available as the nerve-fiber analyzer GDx, is a type of confocal scanning laser ophthalmoscope with a polarized laser beam. When the laser passes through the birefringent RNFL, a phase shift is produced in proportion to the RNFL thickness.[2]

Images from another glaucoma patient OD. L to R: GDx image; deviation map; difference from baseline.
There is also a built-in device to compensate for the polarization effect of anterior-segment tissues, such as the cornea and lens. The older device has a fixed corneal compensation, while the newer devices (GDx-VCC and -ECC) have variable corneal compensation to account for individual differences.
Pros: GDx-VCC demonstrates good sensitivity at detecting RNFL defects, which correlate with VF loss.[3] GDx does not require dilation and yields quantitative data. The RNFL thickness curves acquired at different visits can be graphed together to monitor for worsening.
Cons: GDx measurements are affected by various conditions, such as media opacity, ocular surface and macular diseases and peripapillary atrophy. The VCC device has an artifact from compensating for poor signal-to-noise ratio. This artifact is reduced in the ECC, but upgrading requires new hardware and images taken with older devices cannot be analyzed for change with the newer device.
Optical Coherence Tomography (OCT)
OCT works similarly to ultrasound, but employs a near-infrared light instead of sound. By analyzing the interference pattern of light back-scattered from different layers of the retina, it generates high-resolution, cross-sectional images similar to those seen in pathology slides.[4]
The time domain OCT (TD-OCT) has a 10 micron axial image resolution and acquires 400 A-scans per second. This speed limits the number of scans performed without motion artifacts, so that only three circular scans around the ONH can be acquired to construct an image of the peripapillary RNFL.
Spectral domain OCT (SD-OCT) has an image resolution of 5 microns and an acquisition speed of > 20,000 A-scans per second. Hence, it can scan a much denser area, generating a cube-shaped 3-D image of the peripapillary region.
Pros: RNFL measurements by OCT show good reproducibility. The RNFL thickness curves are compared to an age-specific normative database. Thinning in superior and inferior quadrants correlates well with VF defects. SD-OCT does not require dilation and shows exquisite details of different tissue layers, in addition to the RNFL. Pathology in other layers of the retina, such as peripapillary atrophy, optic nerve head drusen and optic nerve pit, can be visualized.
Cons: RNFL thickness values are affected by age, disc size and tilt and axial length of the eye. TD-OCT may require dilation and lacks an ethnicity-specific normative database. Furthermore, progression analysis is difficult because the scan may not be accurately centered on the ONH, and there is no software in TD-OCT to register follow-up scans to the baseline. SD-OCT can perform progression analysis and registration to the same location of scanning.
However, RNFL-thickness values measured by SD-OCT differ from those measured by TD-OCT. There is also instrument variation among different SD-OCT machines. Hence, a change in RNFL thickness is difficult to determine if images were taken with different OCT instruments.
Summary
Imaging can aid the diagnosis and monitoring of glaucoma by providing objective documentation and measurements of ONH parameters and RNFL thickness. However, it does not replace a careful clinical evaluation or visual field testing. There is no single device that outperforms the rest in terms of distinguishing glaucoma from normal.[5,6]
Furthermore, the chronic nature of glaucoma presents a challenge in the face of rapidly evolving imaging technology. Often, the imaging test of choice is determined by the patient’s prior imaging and by the availability of instruments in your office.
While disc photography and SD-OCT are my personal recommendations for baseline imaging, even glaucoma specialists cannot agree on which instruments to use for particular types of patients. A good understanding of the pros and cons of each imaging modality will help you to critically evaluate the test results and incorporate useful information into the management of glaucoma.
References:
- Weinreb, R.N., A.W. Dreher, and J.F. Bille, Quantitative assessment of the optic nerve head with the laser tomographic scanner. Int Ophthalmol, 1989. 13(1-2): p. 25-9.
- Wollstein, G., D.F. Garway-Heath, and R.A. Hitchings, Identification of early glaucoma cases with the scanning laser ophthalmoscope. Ophthalmology, 1998. 105(8): p. 1557-63.
- Bowd, C., et al., Structure-function relationships using confocal scanning laser ophthalmoscopy, optical coherence tomography, and scanning laser polarimetry. Invest Ophthalmol Vis Sci, 2006. 47(7): p. 2889-95.
- Wojtkowski, M., et al., Three-dimensional retinal imaging with high-speed ultrahigh-resolution optical coherence tomography. Ophthalmology, 2005. 112(10): p. 1734-46.
- Badala, F., et al., Optic disk and nerve fiber layer imaging to detect glaucoma. Am J Ophthalmol, 2007. 144(5): p. 724-32.
- Sharma, P., et al., Diagnostic tools for glaucoma detection and management. Surv Ophthalmol, 2008. 53 Suppl1: p. S17-32.
* * *
About the author: Lucy Q. Shen, MD, is a glaucoma specialist at the Massachusetts Eye and Ear Infirmary and a clinical instructor at Harvard Medical School. Her research interests include assessing structural-functional relationships in glaucoma.