By Lea Hyvärinen, MD, PhD; Renate Walthes, PhD; Namita Jacob, CHRP, CHRL; Linda Lawrence, MD; P. Kay Nottingham Chaplin, EdD
Among cognitive functions, vision plays an important role during the development of communication, interaction and bonding, spatial awareness, ocular motor, and motor functions. This chapter begins by describing delays in visual development during the first year that are not routinely detected. These undetected delays may derail children’s emotional and cognitive development. This chapter also covers observations on how the assessment of developing functional vision is used in early intervention and education for infants and older children who have atypical vision.1,2,3
Milestones: 0-3 Years
During the first year, delays in the development of five important functions are easy to detect as delays in reaching visual milestones.
Delays in visual communication can be noticed as failing eye contact in newborn infants.
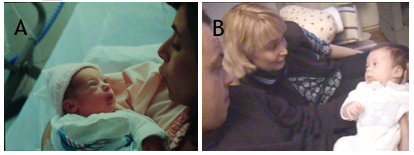
Figure 1. A. Newborn infant looks at her mother's eyes and copies lip movements. B. At 8 weeks of age, an infant can communicate with both parents in turn.3
Delay in development of eye contact
Delay in development of eye contact is usually caused by weak or no accommodation or high hyperopia, which can be treated with proper near correction glasses for communication (Figure 2). Face blindness, or prosopagnosia, is a rare cause and difficult to diagnose at this age; thus, an infant with a delay in eye contact and normal eyes should be treated as functionally blind. Training in total communication should be part of early intervention, and the infant should be examined by a pediatric neurologist for other signs of disorders in brain function.

Figure 2. A. This infant turned her head away from her mother’s face. She had no accommodation or convergence and refraction was +1.0 OU; therefore, images were blurred and doubled on her retinas. B. Near correction with +4 lenses permitted clear images on the retinas. C. The baby's vision converged and, after a few seconds, this 4-month-old baby smiled at her mother for the first time. (See Videos 1A and 1B at http://www.pro-vision-dortmund.de/videos).2,3
These infants with delay in the development of accommodation may become esotropic when they begin to accommodate, usually at the age of 6 months.
Delay in development of lively communication with social smile can be noticed during the third month and is the second easily noticeable visual milestone.
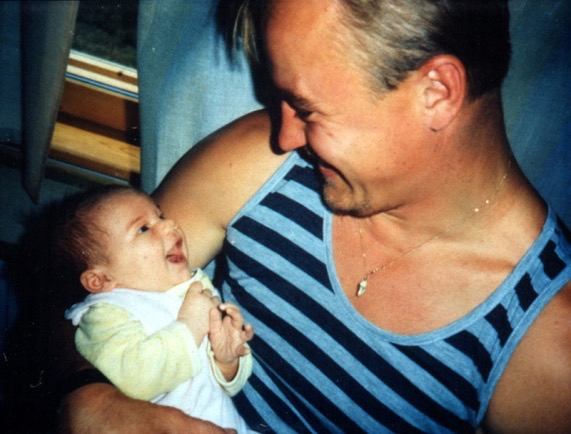
Figure 3. Enjoyable visual communication between baby and father.3
Delay in awareness of hands and hand regard
Delay in awareness of hands and hand regard, the third visual milestone, can be observed during the third month. Infants notice their hands moving in front of their face, learn to decrease the speed of movement, and turn their hands as if watching their fingers as a grating-like pattern at varying distances. This activity is likely to support development of fusion of images and stereo vision.
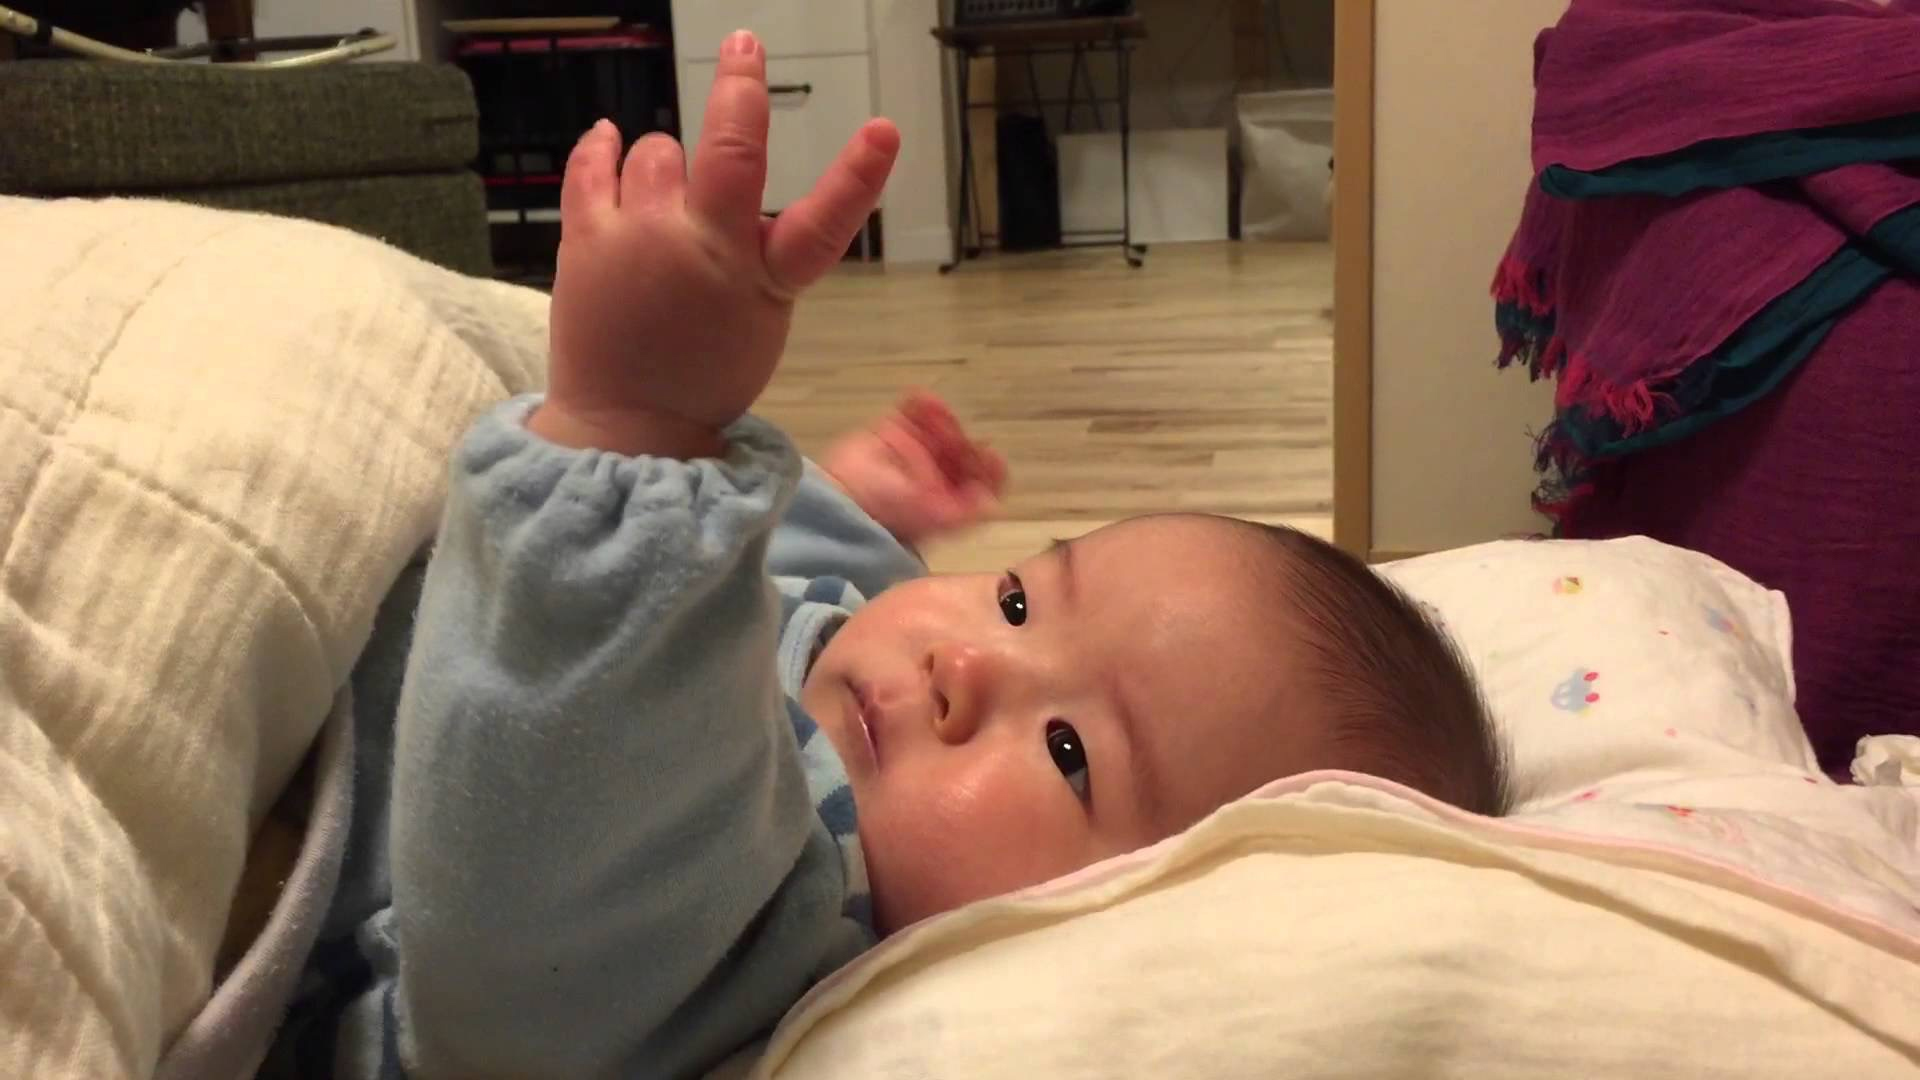
Figure 4. Discovering one’s own hand requires hours of study. (Photo: Akito's hand regard 20150120, YouTube link - https://www.youtube.com/watch?v=GmgoHKead_M).
Delay in goal-directed hand-arm movements for reaching and grasping
Delay in goal-directed hand-arm movements for reaching and grasping, the fourth visual milestone, can be observed during the fifth or sixth month. When infants have trained their hand movements, they watch other infants and children reach toward and grasp objects and they learn to copy these movements. This opens a window into understanding other persons’ activities and goals.
Delay in recognition of facial features
Delay in recognition of facial features, the fifth easily detected visual milestone, can be observed between the ages of 7 and 10 months. Face blindness is possible to diagnose at this age and should not be confused with autistic behaviors, because infants with “autistic-like behaviors” are not referred for assessment of vision in most countries. Without training in communication, development in infants with face blindness may derail.
When any of these delays is noticed, the infant should be examined by a pediatric ophthalmologist or an ophthalmologist accustomed to assessing young children. If an infant's failing eye contact at the age of 6 weeks does not improve after two weeks' active communication by the parents, it can cause great stress on the family. The infant should therefore be examined at the age of 8 weeks for hyperopia and weak accommodation as a part of usual assessment of visual functioning. If refraction and accommodation are normal, the infant should be examined by a pediatric neurologist for possible face blindness and other neurologic signs of delays in the development of the visual brain, especially the mirror neuron system.
Similarly, each time a delay is noticed in any of the vision-related developmental steps, vision should be assessed before therapies are started, so that poor quality of vision is diagnosed, treated, and included in early intervention.
During the first year, clinical assessment can include two tests for assessment of vision for communication (Figure 5). The HIDING HEIDI® low-contrast test (Good-Lite) measures communication distance. The Pepi-test, a computer-based test, is used to observe eye movements and perception of a moving picture (figure-in-motion). Facial expressions are low-contrast information in motion; therefore, the two tests together help assess vision for communication.
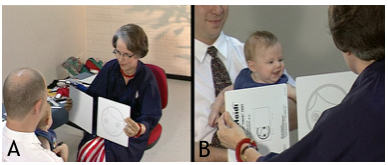
Figure 5. A. The low-contrast picture of the smiling HIDING HEIDI® face is placed behind the white cover in front of the infant and then shown by moving the cards with the same speed in opposite directions. B. If a 3-month-old infant responds with a combined following movement of eyes and head and then smiles, he is assumed to have seen the low contrast picture.3
During the first year of an infant's life, the mirror neuron system is seldom discussed, although it is instrumental in all copying functions, from facial expressions to goal-directed reach. If its development is delayed, infants with this delay, as well as those who have additional disorders, should be given communication and motor training so that weak functional connections can be strengthened. Early intervention should begin immediately and include vision specialists as team members.
Infants develop many more functions2 than the ones described above, but they are not as easily recognized as the five functions used as visual milestones during the first year.
These five milestones should be noticed in all infants. Infants at risk of delayed visual development, including those with Down syndrome, all hypotonic infants, and all infants with a disease or syndrome that is often combined with vision disorders, should be examined thoroughly at the age of 2-3 months at the latest.
During the second year, development of motor functions allows for increased exploration of the infant’s world, facilitates development of the concept of forms, and of the concept of “same” related to forms, which is central in testing visual acuity (VA) in young children.
Calibrated VA tests based on geometric forms of concrete objects (LEA SYMBOLS®); and abstract, more difficult Sloan letters; and LEA NUMBERS® (Good-Lite) are available for children. These tests are calibrated with the international reference optotype Landolt C, and in cohorts of young, normally sighted adult subjects, the mean visual acuity values are the same as those with the Landolt C test.4 Toddlers can be trained with the LEA 3D PUZZLE® (Good-Lite; see the videos at http://www.pro-vision-dortmund.de/videos) if it is diagnostically important to measure visual acuity early, first binocularly, that is, the functional visual acuity, and later the diagnostic monocular acuities when the infant/young child tolerates covering eyes in turn.
Visual processing functions in the brain are difficult to diagnose in young children, especially if the child functions normally in many vision-related tasks (Figure 6). These children do not belong in the group of children with cortical visual impairment (CVI), because their visual acuity may be normal or because they have changes in the eyes. Test games designed for diagnosis of early visual processing in the occipital lobe depict processing of sizes and lengths of objects and lines (LEA RECTANGLES GAME® [Good-Lite]) and of directions of lines (LEA MAILBOX GAME® [Good-Lite]). The HEIDI® EXPRESSIONS GAME (Good-Lite) reveals whether there are difficulties in recognition of details in facial features, which is important to prove so the child is not diagnosed as having autistic behaviors.

Figure 6. A. In the LEA RECTANGLES GAME®, eye-hand coordination (parietal lobe function) and pure visual comparison (inferotemporal lobe function) of length are used to assess vision for sizes/lengths of lines/objects. B. In the test with LEA MAILBOX GAME®, this 33-month-old, prematurely born girl had difficulties with the rotation of her right wrist, which is typical of the weak hand functions of many prematurely born infants with vision problems. Therefore, the test was used in horizontal orientation to avoid the noticed difficulty. C. The HEIDI® EXPRESSIONS GAME detected that this well-functioning child with mild cerebral palsy has difficulties in visual communication. She did not know what the names of facial features meant. The question was, “In which of your cards is the mouth the same as the mouth in the picture of my card?” The choice was made easier by reducing the number of cards to two, then using kinesthetic information to draw the mouth on each of the three cards. Nothing made the question understandable, however. For her, the parts of the face were tactile. The parents’ suspicion of face blindness was confirmed. (See Videos 1, 2, and 3 in WHAT and HOW Does This Child See?).3
Assessment of the early visual processing in the occipital lobe is rarely used, although there are several tests available. In cerebral palsy, concepts of directions and length/sizes are often distorted; therefore, the tests depicting these functions were chosen. In this case, these functions were normal, but recognition of facial structures had not developed.
During the third year, children’s visual acuity is easier to assess at close distances than at the intermediate distances used for screening where HOTV and LEA SYMBOLS® tests are used. If the infant is assessed for possible CVI, testing with the four abstract Sloan letters, the four abstract LEA NUMBERS® (after training matching), and the four LEA SYMBOLS® (pictures of concrete objects) using a near test (Figure 7) may reveal specific problems in recognition functions. Differences in measured values may be due to variation in maturation of recognition functions or, if the differences persist, may be related to specific small lesions in the inferotemporal cortex (ventral networks).
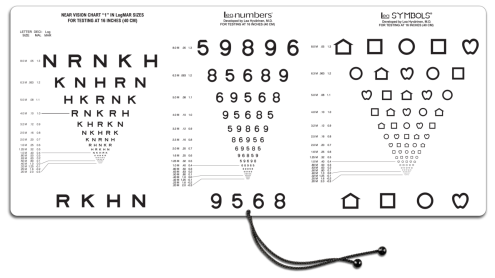
Figure 7. The “Three Near VA Tests in One”- test is based on four Sloan letters, four LEA NUMBERS®, and four LEA SYMBOLS® and printed as one test to make the comparison of the measured values easier (Good-Lite 2015). The “Four Near VA Tests in One” includes the three calibrated tests and the Landolt C test (Good-Lite 2015). It is designed for countries where the Landolt C test is used in vision screening and assessment, although is it not a recognition acuity test.
Crowding phenomenon
When a child is 3 years old, assessment using the tests with 50% or 25% spacing is often experienced as too difficult; the child may say “Can’t look at them, they hug each other.” The development of tolerance to crowding has been investigated in numerous publications that could be considered in assessment of visual acuity. 1,5,6,7
Preschool Years
During the fourth year, contrast sensitivity (CS) measurements are not possible with grating tests, but low-contrast optotype tests permit measurements of the CS curve (Figure 8) using charts with 2.5% and 1% contrast.3
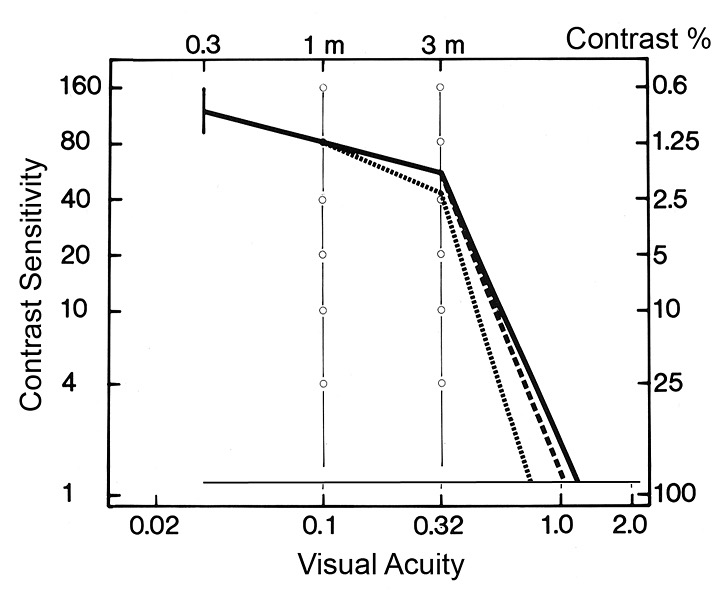
Figure 8. Contrast sensitivity (CS) curves of mean values for 3- and 4-year-old children (dotted line) and 5-year-old children (dashed line) join the adult curve (bold line) at the lowest-contrast values; that is, infants and young children had normal low contrast vision. Full-contrast visual acuity values (about 90% contrast) were lower than the adult values because the youngest children lost interest when the optotypes were “too small.” The large faint optotypes at 1% contrast were easy to recognize.
For details on Figure 8 visit:
http://www.lea-test.fi/index.html?start=en/vistests/instruct/contrast/clinical.html
Contrast sensitivity is rarely measured in clinical assessment; therefore, the presence of useful vision at low contrast is not known. To demonstrate the role of low-contrast vision, Lamberto Maffei in 1981 filtered a picture of Madonna and Child (Figure 9).3 As seen in Figure 9, visual information for round forms is transferred by low and intermediate spatial frequencies, that is, grating acuity values below 10 cpd, which is equal to 20/60 (0.32) in normal vision. The fine lines add only high contrast narrow lines (Figure 9C.). The “low vision” area (low and intermittent spatial frequencies and with VA values below 20/60, for example) is the part of vision with the highest sensitivity. This also applies to individuals with impaired vision.
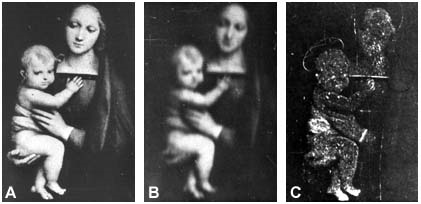
Figure 9. A. The original picture. B. Lines thinner than 10 cpd have been filtered; thus, the information present is composed of broad lines (VA less than 20/60). C. Lines broader than 10 cpd were filtered; the remaining visual information is composed of fine lines (VA higher than 20/60).
Round forms are composed of broad lines at varying contrast levels; the lightest areas are close to 1% contrast (ie, contrast sensitivity in typically developing children is similar to that of normally sighted adult persons).3
Increased crowding effect: Visual acuity values in preschool-aged children are measurable at near and far distances with the standard line tests (100% spacing). On the more crowded tests of near vision, the spacing is 50%, 25%, and 12%. These tests are important in detection of increased crowding effect, which should be known when assessing vision for reading and other demanding tasks.
During the fifth year, children may be evaluated because of difficulties in learning to read. Grating acuity tests become important in assessment of children who have reading difficulties despite normal visual acuity. The test situation is difficult for many children during the first measurements, so using different sizes of text and different fonts and spacing usually makes the test easier and more reliable. In these cases, need of magnification may be surprisingly high8; text sizes may be 30-40 points, even 72 points, when children begin to learn to read. Teachers have created texts at the different reading levels by using identical age-appropriate paragraphs of text with different fonts, font sizes, and spacing between letters and lines. A child usually says without hesitation which text is “good”; thus, the teacher starts with a text that often requires only a few changes. These children benefit from the flexibility of magnification when using tablets, and may also benefit from using Bookshare® and Dyslexie Font.
A normal visual acuity value, even when correctly measured with calibrated tests, does NOT guarantee that vision is normal in a child with reading difficulties; therefore, all visual functions should be thoroughly investigated (refer to Figure 12 below).
Kindergarten and School Years
During the sixth year, it is often possible to measure Goldmann visual fields (Figure 10) in detail. Children with cerebral palsy, in a testing situation, may have difficulties in letting their eyes jump to a bright spot appearing in a certain direction on the cupola. During those saccades, the child’s therapist, supporting the child during the measurement of the Goldmann field, may notice tonus increase.

Figure 10. A. Images depict Goldmann visual fields of a student who was born prematurely (26 weeks, 520 g), has mild spasticity, lung changes due to prematurity, gastrointestinal problems, face blindness, and complex visual problems that require use of high magnification of texts and dictation software to reduce the need for writing. The child has severe problems in map-based and route-based orientation in her environment and must use a guide dog (the trainer teaches the routes to the dog; the student obeys the dog). Her visual acuity varies between 20/20 and 20/10, contrast sensitivity is normal, and visual fields are of normal size, but the central isopters are smaller than normal and in the left visual field, a large temporal area has irregular function (the isopter cannot be defined, dashed line). This student is the same girl as in Figure 6B. Her grating acuity cannot be measured because the grating lines are seen only at the edges of the grating stimulus of 6.5 degrees. C. Distortion of grating lines has been known since the 1970s, when irregularities were described in the fine lines by a man with an amblyopic eye. He could draw what he saw with his amblyopic eye by using his normal eye for drawing. Value “c/d” is “cycles (pairs of lines) in degree of visual angle” (slide from J Atkinson, 1997).
Grating acuity (GrA) measurements3,8 are important in assessing children with reading problems despite normal recognition acuity because these children may have low grating acuity and distortion of lines in the middle of the central visual field, or the center of the grating image is perceived as “empty,” with some colorful dots floating in the empty space (Figure 10B). These distortions of high spatial frequency lines were first described by an adult person in his amblyopic eye’s vision in the 1970s, when contrast sensitivity was measured with computer-generated gratings (Figure 10C). During follow-up, some children with reading difficulties have been diagnosed with several problems in their cortical function.
Although grating acuity tests are widely used as preferential-looking tests in assessment of infants’ and young children’s vision, these detection grating acuity values are reported in many countries as recognition acuity values. The testers are unaware that grating acuity values are close to optotype acuity values only in normally sighted young people, not in very young infants (whose central vision is different from normal adult vision) or in children and adults with impaired vision and low visual acuity. This was known in the 1970s but has not been included in clinical teaching. Figure 11 depicts the most important facts.

Figure 11. A. Contrast sensitivity curves of normally sighted people are regular in their structure: the descending slope of the curves is always in the same location,9 independent of the size of the grating stimulus; thus, there is only one grating acuity value. Grating acuity (GrA) is the point on the X-axis where the slope’s extension reaches the X-axis. B. Contrast sensitivity (CS) curves of a patient with a macular lesion in the right eye show that the normal regular structure of CS curves is not present in impaired vision with lower than normal visual acuity; the size of the grating plays an important role: the larger the stimulus, the higher the CS curve and the higher the GrA value.10 The optotype acuity value (xL) of the normal left eye (L) corresponds to the slope of the left eye. Three different grating acuities and contrast sensitivity values of the right eye were measured using three different stimulus sizes (10, 5, and 2.5 degrees). The optotype acuity value (xR) was slightly lower than the GrA value measured with the smallest grating stimulus.
In clinical measurements using Teller Acuity Cards® and LEA GRATINGS®, the gratings are large and close to the infant; therefore, these tests overestimate grating acuity of young infants but are useful in following whether the monocular responses develop symmetrically.
A measurement that uses both large and small stimuli depicts the grating acuity values best. When testing with the LEATM Grating Acuity test (Good-Lite), the tester walks slowly toward the child and learns at what distance the child sees the grating lines and whether the lines are straight. If lines are not seen as straight, the tester walks slowly closer to the child until the lines are seen straight in the middle. This distance is used for calculation of the true grating acuity value. Many educational vision teams use grating tests and thus are aware of the poor quality of the most central visual field, even if visual acuity as recognition acuity is high normal. Presently, many visually impaired children with CVI and normal recognition VA values are wrongly denied services for visually impaired students, owing to their “normal” VA values.
Profile of visual functioning
At school age, the number of vision-related tasks and activities increases rapidly; teachers, therapists, and orientation and mobility training (O&M) instructors report their observations and hope to receive explanations from ophthalmologists for students’ atypical behaviors.
Because the variation in the symptoms of vision-related problems is great, especially when visual processing problems (CVI) are suspected, information for functional assessment should be collected in a structured way. Schools and kindergartens have lists of vision-related functions that are important at different grade levels. These give a quick overview of a child’s strong and weak areas of functioning (Figure 12). If teachers, therapists, and families agree on the quality of vision in each of the functions on the list, they color-code these functions as either normal, typical functions (N), impaired but useful functions (I), or profoundly restricting functions (P). The Profile of Visual Functioning provides a quick overview of a child’s visual functioning at school.
Figure 12. Profile of Visual Functioning, Example
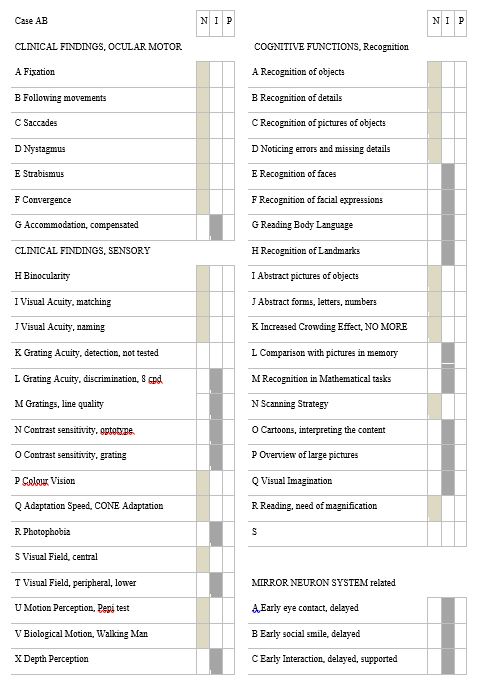
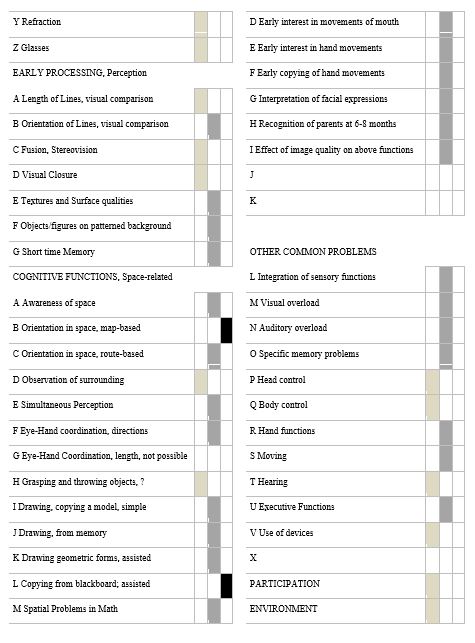
Figure 12. This is a typical Profile of Visual Functioning of a student with normal eyes, periventricular leukomalacia, loss of part of the lower visual field, accommodation insufficiency compensated with glasses, and several atypical visual processing functions. His early development had shown delays in the development of visual communication, as well as recognition of family members. This may in part be caused by poor quality of images due to low contrast sensitivity and poor motion perception, because pictures were much easier to interpret than facial expressions during communication (low contrast information in motion). Observations were gathered from family members, therapists, and teachers, as well as clinical findings from the child’s ophthalmologist, optometrist, and pediatric neurologist for the first functional assessment in the child’s classroom. The different degrees of functional losses were marked with shades of gray, which gives a quick overview of the child’s functioning. If a function was not observed or measured, a short explanation of “not possible” was noted to describe the reason it was not observed or measured. For example, "Exact grasping of the rectangles in an eye-hand coordination test was not possible due to mild spasticity of the boy’s hands."
As pediatric or rehabilitation ophthalmologists, we often feel puzzled when assessing school children. Their activities and tasks are so numerous and complex in today’s schools that it is often difficult to know which details of visual functioning should be assessed. Fortunately, a good transdisciplinary approach in the care of children, with information from families, therapists in early intervention, classroom teachers, special education teachers, and orientation and mobility training (O&M) instructors helps in the assessments for early intervention and rehabilitation of children during the important formative years.
Conclusion
This chapter discusses two areas in early development: The first area is observing delays in the visual milestones during the first year. These delays often go undetected, which may derail an infant’s emotional and cognitive development. Early detection by parents and pediatricians could be improved if information on vision in early development were available. The second area involves early loss of vision with incomplete functional diagnoses in older children. Incomplete diagnoses occur because commonly used clinical assessments do not include the additional testing required. Visual acuity at full and low contrast levels using calibrated tests (near and distance), crowding phenomenon, grating acuity, contrast sensitivity measured using gratings of at least two sizes, motion perception, depth perception, visual fields, color vision, and adaptation to luminance changes require varying test techniques adapted to children’s ocular motor problems and communication difficulties. These tests are used selectively when they depict functions that a child’s educational team believes are problematic.
At a minimum, if the core tests could be used by therapists and teachers on the educational team and by local eye care professionals, children’s visual functioning would be better understood at the basic health care level and in educational settings.
References
- Doron R, Spierer A, Polat U. How crowding, masking, and contour interactions are related: a developmental approach. J Vis. 2015;15(8):1-14. doi:10.1167/15.8.5.
- Hyvärinen L, Walthes R, Jacob N, Chaplin KN, Leonhardt M. Current understanding of what infants see. Curr Ophthalmol Rep. 2014;2(4):142-149. doi:10.1007/s40135-014-0056-2. Video films are visible @ http://www.pro-vision-dortmund.de/videos
- Hyvärinen L, Jacob N. WHAT and HOW Does This Child See? Helsinki, Finland: VISTEST Ltd., Hämeen Kirjapaino Oy; 2011.
- Candy TR, Mishoulam SR, Nosofsky RM, Dobson V. Adult discrimination performance for pediatric acuity test optotypes. Invest Ophthalmol Vis Sci. 2011;52(7):4307-4313. doi:10.1167/iovs.10-6391.
- Herzog MH, Sayim B, Chicherov V, Manassi M. Crowding, grouping, and object recognition: a matter of appearance. J Vis. 2015;15(6):1-18. doi:10.1167/15.6.5.
- Norgett Y. Siderov J. Foveal crowding differs in children and adults. J Vis. 2014;14(12):1-10. doi:10.1167/14.12.23.
- Song S, Levi DM, Pelli DG. A double dissociation of the acuity and crowding limits to letter identification, and the promise of improved visual screening. J Vis. 2014;14(5):1-38. doi:10.1167/14.5.3.
- Hyvärinen L. Low grating acuity in slow readers with normal recognition acuity. Acta Ophthalmol. 2014;92(6):e488. doi:10.1111/aos.12391.
- Hyvärinen L, Rovamo J, Laurinen P, Peltomaa A. Contrast sensitivity function in evaluation of visual impairment due to retinitis pigmentosa. Acta Ophthalmol (Copenh). 1981;59(5):763-773.
- Hyvärinen L, Laurinen P, Rovamo J. Contrast sensitivity in evaluation of visual impairment due to macular degeneration and optic nerve lesions. Acta Ophthalmol (Copenh). 1983;61(2):161-170.