Before discussing clinical office procedures (or even treatments for INS) it is necessary to fully understand the primary deficit in visual function faced by the nystagmus patient. It is not, as is commonly believed, a lowered peak best-corrected visual acuity (BCVApk or VApk). The primary deficit in real-world visual function caused by INS is the dramatic reduction in high-acuity, gaze-angle range, HAgar (ie, the acuity present when looking at targets in the visual field that are lateral to the angle with the highest BCVA and are within 10% of that peak value).
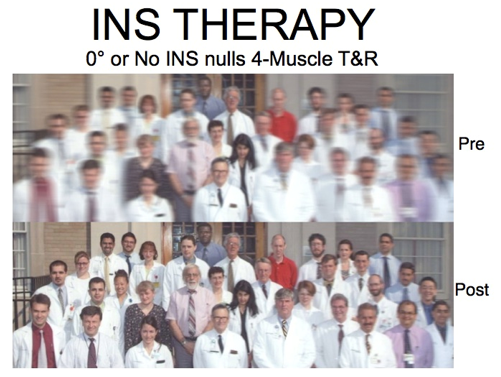
Figure 3 (Pre) illustrates the major visual deficit in INS (top) and its alleviation following T&R surgery (Post). It should be stressed that this photograph does not depict the falling off of visual acuity as distance from the fovea increases. Rather, it illustrates the diminished foveal visual acuity at different gaze angles lateral to that with the peak acuity (here shown as primary position). Prior to T&R therapy, the identification of individuals to both sides is very difficult.
It should be noted that the therapeutic improvements to that INS-induced acuity reduction may reach 1600%.57 Decrements from VApk are dependent solely on reductions from peak INS foveation quality. They may be measured by the NAFX at different gaze angles. The resulting decrement is expressed as the longest foveation domain, LFD, which is defined as the range of gaze angles whose NAFX is within 10% of NAFXpk; the LFD is independent of any associated visual deficit. During clinical examination, HAgar can be determined directly from BCVA measurements made at different gaze angles; it is the clinical and numerical equivalent of the INS-waveform-determined LFD (HAgar=LFD). Because the primary, real-world deficit in INS is a low HAgar, measuring BCVA only at the patient’s best gaze angle, either pre- or post-therapy, can neither fully describe the total INS deficit nor provide information necessary to evaluate its possible amelioration and improvements in visual function.

Figure 3. Illustrations of the clarity of portions of the visual field in an INS patient with a narrow, central, null (sharp, central NAFX peak) before (Pre) and after (Post) tenotomy and reattachment surgery. This procedure can also be used in cases where there are no nulls.
Another visual function deficit not measured in the office but amenable to therapy is foveation time (ie, target acquisition time).58; 59 This is important in every-day activities like, quickly scanning a room for familiar faces, reading street and traffic signs while driving, and all sports.
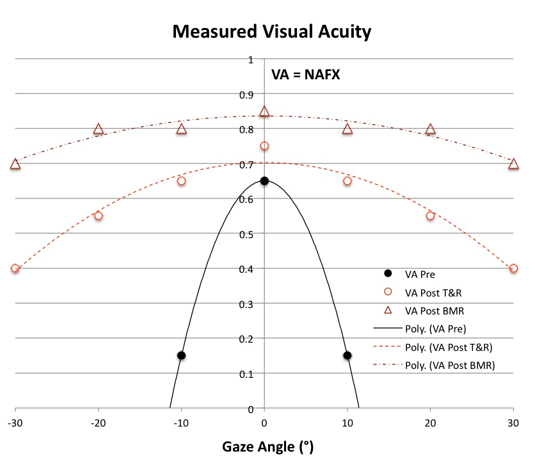
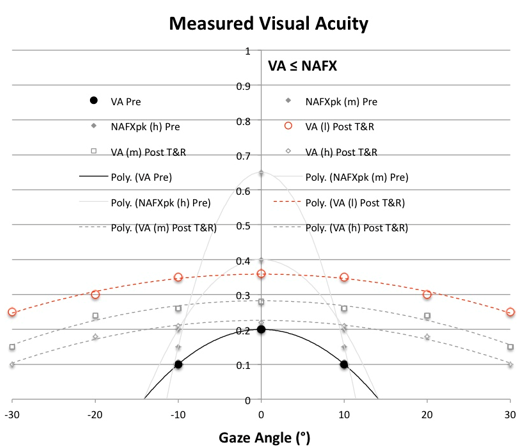
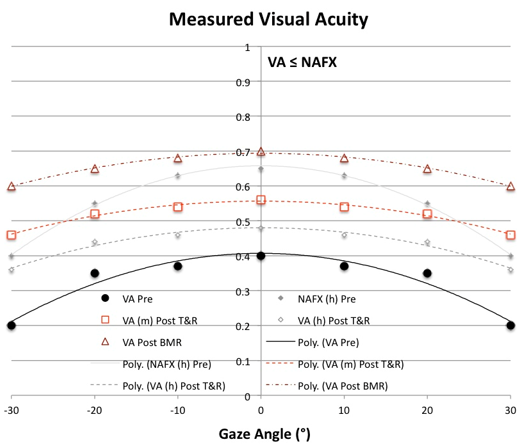
Figures 4 – 6 show the plots of the NAFX vs. gaze angle for cases with high (Fig. 4, solid), low (Fig. 5, solid) and mid-range (Fig. 6, solid) peak visual acuities. In Figures 5 and 6, the solid grey curves show possible high and low curves for NAFX (Fig. 5) and high curve for NAFX (Fig. 6) that could accompany patients with these respective visual acuity profiles; these more complex relationships in patients illustrated by Figures 5 and 6 make determination of therapeutic improvements more difficult (see Section 7). Note that the solid curve of Figure 4 corresponds to the visual picture of Figure 3 (Pre) and the dashed curve corresponds to Figure 3 (Post).

Figure 4. Measured VA vs. Gaze Angle plots for patients with high VApk = NAFXpk in or near primary position and low HAgar = LFD including: VAf = VAn, ± strabismus and VAf < VAn, no strabismus. In Figure legends 4 – 6, f = far, and n = near, T&R = tenotomy and reattachment, BMR = bimedial rectus recessions, and BOPr = base-out prism. Solid = pre-therapy curve, and dashed and dot-dashed = post-therapy T&R and BMR/BOPr curves respectively, Because Figures 5 and 6 include different possible combinations of INS characteristics, they are more complex than the simple plot from an individual patient, which, like Figure 4, would only contain that patient’s personal pre- and post-therapy acuities.

Figure 5. Measured VA vs. Gaze Angle plots for patients with low VApk ≤ NAFXpk in or near primary position, low HAgar = LFD, and VAf = VAn ±strabismus including the following possibilities: a) low NAFXpk at near and far; b) mid-range NAFXpk at near and far; or c) high NAFXpk at near and far. For clarity in the more complex cases of Figures 5 and 6, individual VA measurements were deemphasized in favor of the 2nd-order trend lines for some of the possible conditions. Pre-therapy NAFX curves of equal LFD values and post-therapy VA curves for conditions b) and c) are shown in grey. Solid = pre-therapy VA and possible NAFX curves and dashed = post-therapy T&R curves. Here and in Figure 6, h = high NAFXpk (>0.6), m = mid-range NAFXpk (0.25 ≤ NAFXpk ≤ 0.6), and l = low NAFXpk (<0.25).

Figure 6. Measured VA vs. Gaze Angle plots for patients with mid-range VApk ≤ NAFXpk in or near primary position, high HAgar = LFD, including: VAf = VAn, ± strabismus or VAf < VAn, no strabismus. The following possibilities are also included: b) mid-range NAFXpk at far; or c) high NAFXpk at near and far. Pre-therapy NAFX curves of equal LFD values and post-therapy VA curves for conditions b) and c) are shown in grey. Solid = pre-therapy VA and possible NAFX curves and dashed and dot-dashed = post-therapy T&R and BMR±T&R/BOPr curves respectively.
Clinical
To adequately document their visual function deficits, all patients with nystagmus (INS or FMNS) must undergo measurement of their gaze-angle BCVA OU; that is, measurement of BCVA at different gaze angles. That will document the major symptomatic deficit in INS, the inability to maintain their BCVA when looking to the right or left of center (or of their idiosyncratic “null” angle). In cases of INS with a latent component, gaze-angle BCVA should also be measured OD and OS. Methods of measuring BCVA at different gaze angles in the clinical office may be found elsewhere.2; 51 Only by making gaze-angle acuity measurements the standard of care for nystagmus patients, can adequate data be collected from which prospective therapies may be chosen and their visual function improvements determined. For binocular (ie, no strabismus) INS patients whose nystagmus damps with convergence, the gaze-angle BCVA should be measured OU with 7 PD BO prisms and -1.00S added OU to their refraction (the -1.00S should not be added for presbyopic patients). In fact, once monocular refraction is determined and monocular acuity measured, the prisms and -1.00S should be added. Thereafter, one should not attempt to measure monocular acuity unless the prisms and -1.00S are removed. Doing so will yield extraneous, lower values of acuity since the prisms will effectively shift the targets to lateral gaze (right gaze for OS viewing and left gaze for OD).
Note: Although greater INS damping with higher foveation-period quality may be achieved with higher values of convergence,60 the amount of prism prescribed should be limited to 7-9 PD BO OU for distance acuity. That will provide most of the improvement in distance BCVA available to the patient while still allowing further convergence for middle-distance and near targets (see Section 7).
In addition to gaze-angle acuity, near acuity, stereo acuity, and ocular alignment (tropias and phorias) should be determined. Contrast sensitivity, color vision, time-dependent acuity, and visual field testing may also be helpful. Finally, a thorough examination of the retina, including the foveal area and optic nerve should be performed.
Electrophysiological
The visual evoked potential (VEP) is an evoked electrophysiological potential that can be extracted, using signal averaging, from the electro-encephalographic activity recorded at the scalp. The VEP can provide important diagnostic information regarding the functional integrity of the visual system. Because chiasmal and retrochiasmal diseases may be missed using a single channel, three channels using the midline and two lateral active electrodes are suggested for INS patients. Pattern reversal is the preferred technique for most clinical purposes but is less reliable in patients with unstable fixation or nystagmus. The results of pattern-reversal stimuli are less variable in waveform and timing than the results elicited by other stimuli. The pattern-onset/offset technique can be more useful in patients with nystagmus, and the flash VEP is particularly useful when optical factors or poor cooperation make the use of pattern stimulation unreliable.
Flash VEPs are much more variable across subjects than pattern responses but show little interocular asymmetry. They may be useful in patients who are unable or unwilling to cooperate for pattern VEPs, and when optical factors such as media opacities prevent the valid use of pattern stimuli. The visual evoked potential to flash stimulation consists of a series of negative and positive waves. The earliest detectable response has a peak latency of approximately 30 ms post-stimulus and components are recordable with peak latencies of up to 300 ms. Peaks are designated as negative and positive in a numerical sequence. This nomenclature is recommended to automatically differentiate the flash VEP from the pattern reversal VEP. For the flash VEP, the most robust components are the N2 and P2 peaks. Measurements of P2 amplitude should be made from the positive P2 peak at around 120ms to the preceding N2 negative peak at around 90 ms.
VEPs should be recorded when the infant or child is in an attentive behavioral state. Direct interaction with the child can help maintain attention and fixation, and two testers are beneficial, one to work with the child and the other to control data acquisition. The order of stimulus presentation also should be flexible and selected to ensure that responses most critical to the diagnostic question are obtained within an individual child’s attention span. Binocular pattern stimulation, which facilitates attention and fixation, may be useful to evaluate overall visual function. Monocular testing to at least one stimulus is desirable to assess the function of each eye. It is particularly important to obtain replicate responses from children to assure that the response measured is a reliable signal and not an artifact. As for adults, additional channels of recording may be important for diagnosis of chiasmal and post-chiasmal dysfunction. Pattern-onset/offset stimuli can be helpful in gaining attention of children and are usually more robust in cases of nystagmus, but the waveform components change with age.
Electroretinography (ERG) evaluation of children with nystagmus has both diagnostic and prognostic value. In patients with nystagmus and a normal clinical examination alone, a true diagnosis of INS without associated sensory system deficits cannot be inferred. Other visual system diseases associated with nystagmus in infancy include: Leber amaurosis, delayed visual maturation, albinism, optic nerve hypoplasia, achromatopsia, and X-linked congenital stationary night blindness. ERG’s have been shown to help in distinguishing between these conditions.
The global or full-field ERG is a mass electrical response of the retina to photic stimulation and is used worldwide to assess the status of the retina in eye diseases in human patients and in laboratory animals used as models of retinal disease. The basic method of recording the electrical response known as the global or full-field ERG is by stimulating the eye with a bright light source such as a flash produced by a strobe lamp. The intense flash of light elicits a biphasic waveform recordable at the cornea. The two components that are most often measured are the a- and b-waves. The a-wave is the first large negative component, followed by the b-wave which is corneal positive and usually larger in amplitude. The amplitude from the baseline to the negative trough of the a-wave, the amplitude of the b-wave measured from the trough of the a-wave to the following peak of the b-wave, the time from flash onset to the trough of the a-wave, and the time from flash onset to the peak of the b-wave are the most common measures. These times, reflecting peak latency, are referred to as "implicit times." The a-wave, sometimes called the "late receptor potential," reflects the general physiological health of the photoreceptors in the outer retina. In contrast, the b-wave reflects the health of the inner layers of the retina, including the “on” bipolar cells and the Muller cells. Two other waveforms that are sometimes recorded for clinical purposes are the c-wave originating in the pigment epithelium and the d-wave indicating activity of the “off” bipolar cells. There are also wavelets that occur on the rising phase of the b-wave known as oscillatory potentials, thought to reflect activity in amacrine cells.
The ERG of a normal full-term infant looks similar to a mature ERG. The ERG attains peak amplitude in adolescence and slowly declines in amplitude throughout life. The ERG can be recorded several ways. The pupil is usually dilated. There are a number of corneal ERG electrodes that are in common use. Some are speculum structures that hold the eye open and have a contact lens with a wire ring that "floats" on the cornea supported by a small spring. Some versions use carbon, wire, or gold foil to record electrical activity. There are also cotton wick electrodes. There are yet other simpler ERG recording devices using gold Mylar tape that can be inserted between the lower lid and sclera/cornea. Most electrodes are monopolar, ie, they are referred to another electrode site, most commonly on the forehead. There are also several methods of stimulating the eye. Most laboratories use a Ganzfeld (globe) with a chin rest and fixation points. The Ganzfeld allows the best control of background illumination and stimulus flash intensity. Either strobe lamp or Ganzfeld methods of flash presentation can be used to record the ERG following a single flash or to average responses to several flashes with the aid of a computer.
Infants up to about 6 months years of age can usually be tested without sedation by the parent holding them bundled in a blanket. Most of our ERG testing is performed as part of a more extensive exam under anesthesia. Anesthesia affects the ERG varying with type and depth of anesthesia. Some anesthetics can attenuate b-wave amplitude as much as 50%. Light levels of anesthesia have little affect and most anesthetics do not usually affect a-waves or implicit times.
Most disorders of the retina are detected by an attenuation of amplitude. Implicit times, of both a- and b-waves are also affected in some conditions. The patient should be dark-adapted for about 30 minutes then the electrodes attached using dim red illumination. The ERG should be recorded using single, scotopic white flashes. Afterwards, turn on moderately high background illumination for about 10 minutes and record ERGs using 30-Hertz flicker and bright white flashes.
Imaging
Optical coherence tomography (OCT) is analogous to ultrasound except that near-infrared light waves instead of acoustic waves are used to measure distances of specific structures. OCT depends on optical ranging; in other words, shining a beam of light onto the object, then recording the echo time delay of light measure distances. Since the velocity of light is so high, it is not possible to directly measure the echo time delay of reflections; therefore, a technique known as low-coherence interferometry compares reflected light from the eye to that reflected from a reference path of known length. Different internal structures produce different time delays, and scanning the incident optical beam can generate cross-sectional images of the structures. These two-dimensional scans are then displayed in a color scale where ‘warm’ colors (red to white) represent areas of high optical reflectivity, and ‘cool’ colors (blue to black) represent areas of low reflectivity. The current technology permits excellent resolution and has been used to help diagnose and guide treatment for macular edema, macular and lamellar holes, epiretinal membranes and pseudoholes, central serous chorioretinopathy, age-related macular degeneration, glaucoma, and optic disc lesions.
Evaluation of the retina in patients with nystagmus can occasionally be difficult because of the constant motion of the eye. Eye motion has impeded the implementation of TD-OCT for diagnostic purposes in the nystagmus population. In addition to eye motion, compromised vision and the shortened attention span of children often compound the challenge of quality TD-OCT macular image acquisition.
The new SD-OCT has allowed a more reliable study of patients with nystagmus. Its use for macular imaging has been reported in patients with albinism and nystagmus. It has demonstrated several features in this population, including the: persistence of an abnormal, reflective nerve fiber layer band; persistence of multiple inner retinal layers; loss of the normal thickened photoreceptor nerve layer; and increased reflectivity of the choroid due to decreased pigmentation. Most external retinal layers, specifically the external limiting membrane, photoreceptor inner segment layer, and photoreceptor outer segment layer, appear normal, in agreement with histopathological studies and less detailed TD-OCT reported findings of either absent or rudimentary foveal pits in oculocutaneous albinism. Observations of the retinal morphology in the nystagmus population reveal that all cases of clinical foveal hypoplasia demonstrate a persistence of the outer plexiform layer, inner nuclear layer, inner plexiform layer, ganglion cell layer, and nerve fiber layer.61
Protocols are currently being designed to align images with scanning laser ophthalmoscope fundus landmarks, such as blood vessels, to remove eye motion artifact caused by micro saccades. Applying this software to the extreme case of eye motion, nystagmus, and incorporating it into a technology that is already available to clinicians would be an exciting and powerful application of the SD-OCT. Because the nystagmus population can also fall victim to common ocular diseases, such as diabetes, glaucoma, and macular degeneration, the use of SD-OCT, especially with software that may reduce eye motion and help recover 3-dimensional spatial integrity, would be an important diagnostic and management tool.
Additional information can be found in Chapter 6 of Nystagmus in Infancy and Childhood. Current Concepts in Mechanisms, Diagnoses, and Management, 2 which contains multiple excellent references regarding the VEP, ERG, and OCT.
Fundus photography in the patients with nystagmus can be a very important adjunct in their clinical evaluation and follow up. In those patients in whom retinal or optic nerve diseases are suspected, photography may be indispensable in assisting with diagnosis and prognosis of associated afferent system diseases. There are multiple methods of obtaining photographs. The use of stereo photos, narrow-angle, high-magnification, and wide-angle, low-magnification techniques can be combined to obtain the best views of the macula/fovea, optic nerve head, and peripheral retina. In patients too young to cooperate for photography while awake, there are multiple types of hand-held and portable intraocular cameras that can be used as part of an examination under anesthesia.